Updated 1 November 2026: an outdated contact form was removed.
The IBM POWER8 processor is starting to appear in financial applications where compute-intensive loads are the order of the day. We decided to check out how IBM’s powerhouse stacks up against Intel’s high-performance CPU offering – the Xeon Haswell – on a typical financial workload. Naturally, both processors can be used with high-performance accelerators – something that is emerging under the OpenPOWER initiative. Nevertheless, we decided to pit the processors against each other to see which delivers more clout.
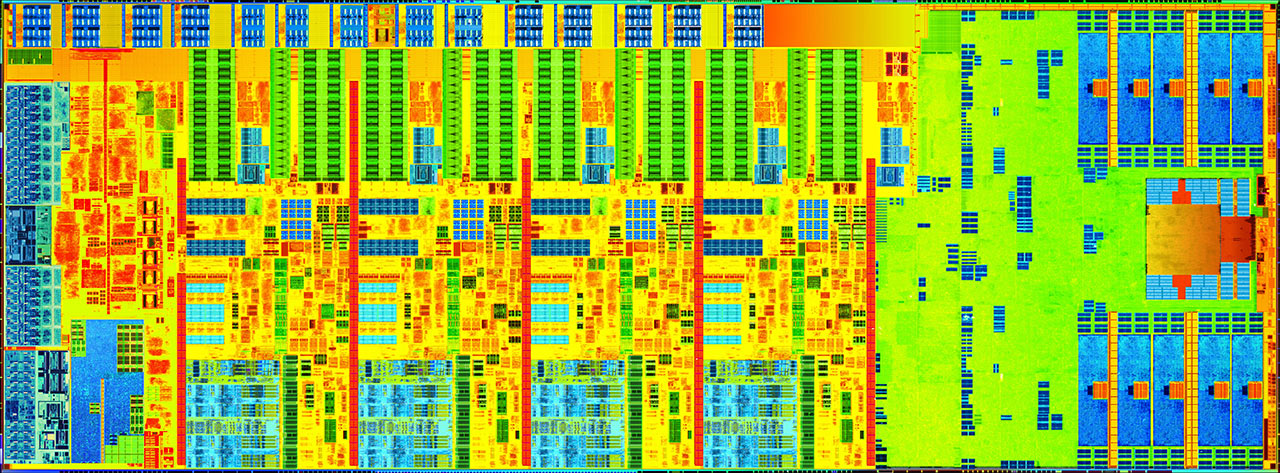
Intel Haswell Processor Die
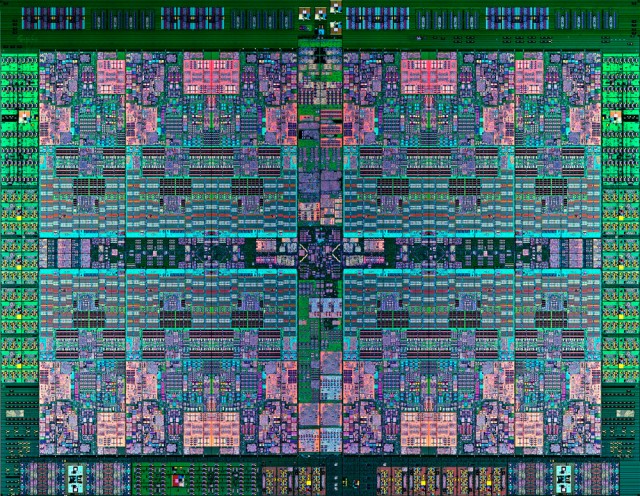
IBM POWER8 Processor Die
Hardware Specifications
We’ll compare Intel’s Xeon E5-2698 v3 (Haswell) and IBM’s ISeries 8286-42A (POWER8) processors for our test applications.
Below are their hardware specifications:
| Haswell (Xeon E5-2698 v3) |
POWER8 (ISeries 8286-42A) |
|
| Cores | 16 | 12 |
| Logical Cores | 32 (HT) | up to 96 (SMT) |
| Frequency | 2.3 GHz | 3.52 GHz |
| Cache | 40 MB | 96 MB |
| Max Memory Bandwidth | 68 GB/s | 384 GB/s |
| Vector Instruction Set | AVX 2.0 (256 bits) | VMX (128 bits) |
| Max GFLOP/s (single) | 1,178 | 676 |
| Max GFLOP/s (double) | 589 | 338 |
Test Application
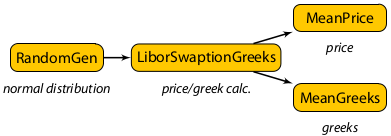
The test application is a Monte-Carlo simulation, pricing a portfolio of LIBOR swaptions and simultaneously computing first order sensitivities (Greeks) to the initial forward rates using path-wise Adjoint Algorithmic Differentiation (AD). The LIBOR market model is applied to simulate thousands of possible future development paths for the LIBOR forward rates, using normally-distributed random numbers. Within each of these Monte-Carlo paths, the value of the swaption portfolio is then calculated by applying a portfolio payoff function. For adjoint differentiation, the algorithm is then executed in reverse to find the Greeks. To obtain the final results, both the price and the Greeks are averaged across all paths. (see Prof. Mike Giles’ notes and the paper Monte Carlo evaluation of sensitivities in computational finance for details).
The processing graph below illustrates the application:
Benchmark Setup
The test systems had the following configuration:
- CPU: 2× Intel Xeon E5-2698 v3 (HT on) and 2 x POWER8 8286-42A (SMT on)
- OS: RedHat Enterprise Linux 6.6 and Ubuntu 14.10
- RAM: 256GB
- Compiler: Intel Compiler 15.0 and IBM Compiler 13.1
The application was compiled with maximum optimization settings, fast math mode, and tuning for the target processor architecture. The generated code makes extensive use of low-level processor features, such as vector extensions, fused multiply-add instructions, cache optimizations, etc.
Performance
We compared the computation times of the test application on both processors, excluding the random number generation. The test swaption portfolio consists of 15 trades and 80 forward LIBOR rates are simulated. Thus the portfolio’s price and 80 Greek values are calculated.
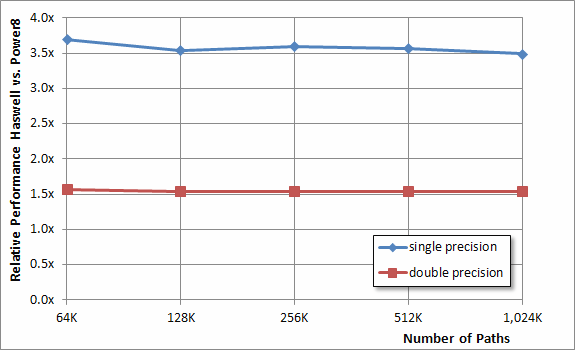
Below is a plot of the relative performance of Haswell vs. POWER8 – for single and double precision.
Discussion
While Intel Haswell is the overall winner for this application (up to 3.7× faster in single precision), IBM POWER8 closes the gap in double – the preferred precision mode in Quantitative Finance. The plot shows near-constant relative performance when varying the number of Monte-Carlo paths, indicating good scalability over the available cores.
The rather large performance difference between single and double precision modes can be explained by the latency-bound nature of this application on Haswell. In single precision, twice the data can fit into the caches. This results in a higher utilization of Haswell’s vector units, hence the greater performance.